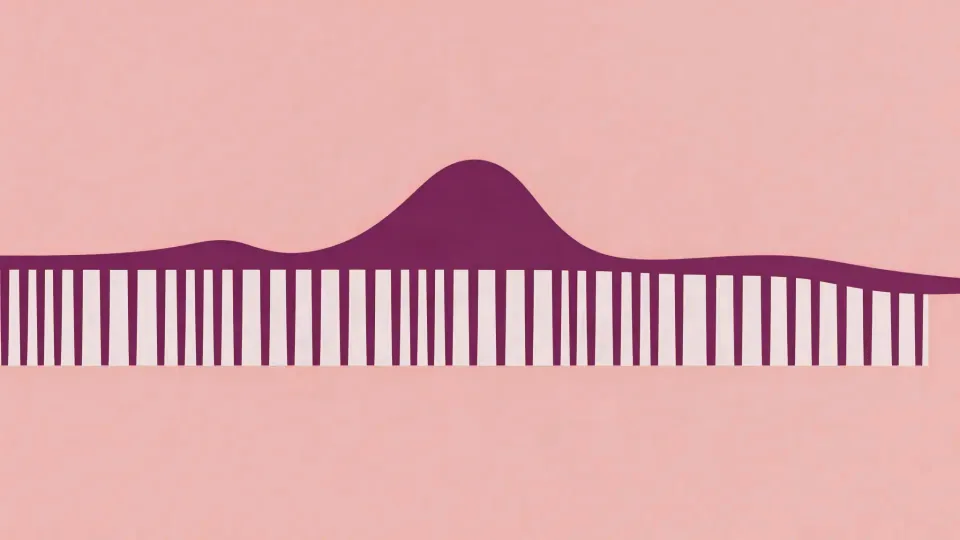
Two graphs, and they answer different questions
Every animation tool has a curve editor, and most people animating in one have never opened it. It is the single highest-leverage panel in the application, because it is the only place the software tells you what it is actually doing between your keyframes.
There are two views of the same data.
- The value graph. Vertical axis is the property’s value: pixels, degrees, percent. Horizontal axis is time. The slope of this line is the speed.
- The speed graph. Vertical axis is velocity: pixels per second. Horizontal axis is time. A flat line here means constant speed.
They are not alternatives; one is the derivative of the other. Blender calls the first an F-curve and gives you handles on it. After Effects gives you the value graph for one-dimensional properties like opacity and rotation, and the speed graph for position, because position has two or three dimensions and three overlapping value curves are unreadable.
What a default keyframe looks like
Drop two keyframes on position, 600 pixels apart, twenty frames apart, and leave them linear. The value graph is a straight diagonal. The speed graph is a rectangle: velocity jumps from zero to 720 px/s at the first keyframe, holds, and drops to zero at the second.
Those two vertical edges are the problem. Nothing in the physical world accelerates from rest to 720 px/s in zero time and then stops dead. Your eye has never seen it and reads it as wrong before you have finished watching.
The arithmetic is worth doing once by hand. Twenty frames, 600 pixels, linear: exactly 30 pixels of travel every frame, from the first to the last. Now ease the second keyframe out: the same journey might be 90 pixels on the first frame and 2 pixels on the last. Same distance, same duration, completely different reading. That difference lives entirely in the graph.
How to read a bad animation
Open the speed graph and look at the shape.
- A flat top. The move has a cruise: it reaches a speed and holds it. Fine for a conveyor belt, wrong for anything that started because somebody pressed a button.
- A sharp spike. All the distance is covered in a couple of frames. Reads as a snap. Often exactly what you want for a small UI element and never what you want for a large one.
- A hump that peaks late. Slow start, fast finish. This is an ease-in, and it reads as something falling or accelerating away. If you applied it to an arriving element, that is your bug.
- Two humps. Something between your keyframes is being overshot and pulled back. Usually an accidental spatial bezier.
- The curve dipping below zero. The property is briefly moving backwards. On position this is a bezier handle overshooting; on scale it is a value going negative and flipping the layer.
Spatial and temporal are separate
This catches everybody once. In After Effects, a position keyframe has two independent interpolations: how the value moves through space (the path on the canvas) and how it moves through time (the speed graph). You can have a perfectly eased speed graph on a path that loops in a curve you never asked for, because the spatial interpolation defaulted to bezier and the software auto-smoothed a corner.
If a layer travels in an arc you did not draw, the fix is in the composition viewer (select the keyframes and set spatial interpolation to linear) not in the graph editor.
The free path
You do not need a paid tool to get a proper curve editor.
- Blender has the best free graph editor of any of them. Every animatable property becomes an F-curve; handles are fully editable; there are built-in modifiers for cycles and noise. It animates 2D shapes, text and grease pencil, not only 3D.
- Glaxnimate is a small, fast vector animator with per-keyframe easing, and it exports Lottie.
- Synfig gives each waypoint an interpolation type (TCB, ease, linear, constant) rather than free handles, which is more restrictive but readable.
- Kdenlive exposes keyframe curves on effects, with a limited set of easing options. Enough for a title, not enough for character work.
Name After Effects in a portfolio because job listings name it. Learn the ideas in Blender if that is what you have, because the ideas are identical and the F-curve editor is more honest about what it stores.
The limitation
A graph editor is a measuring instrument. It shows you what is happening and never tells you what should happen. Two animators looking at the same curve will disagree about whether it is right, and both can be correct for different pieces. What it removes is the category of problem where you keep adding effects because you cannot see that the underlying motion is a rectangle.
The habit worth building: when something feels off, open the graph before you add anything.
Every lesson here is open. Your progress is recorded once you pass the Video with AI exam.
Check your understanding
A layer eases in and out correctly according to its speed graph, but on the canvas it travels in a gentle curve rather than the straight line intended. What is going on?
Pick the one you would defend. Your answer stays private.
 Stuck on something?Ask Deepa, your AI tutor