Each form asserts something different
Before choosing how a picture should look, decide what it has to claim. The three main options make different promises to the reader, and picking the wrong one either overclaims or fails to carry the load.
- A photograph asserts this existed, and it looked like this. It is evidential. It is also stuck with the surface: a photograph of a gearbox shows a metal box.
- An illustration asserts this is the kind of thing being discussed. It is explicitly a representation, so it can be generic without lying, and it can omit. A cutaway drawing shows the inside of the gearbox, which no photograph of an assembled gearbox can.
- A diagram asserts these are the parts and this is how they relate. It abandons appearance entirely for structure. A London Underground map is geographically wrong and is the correct picture, because the question passengers have is about connections, not distances.
A chart is a fourth form, asserting quantity and comparison, and it is covered separately.
The choosing question
Not “what would look good here” but: what does the reader need to do with this?
- Believe it happened → photograph.
- Recognise the type of thing → illustration.
- Follow a process or a relationship → diagram.
- Compare amounts → chart.
- Find their way → map, which is a diagram with geography in it to the extent the task needs.
This resolves most arguments quickly. An article explaining how a sewing machine forms a stitch needs a diagram, and a beautiful photograph of the machine will not substitute, because the stitch happens inside and in stages. An article about a person needs a photograph, and an illustration of a generic person would drain it of the one thing it had.
Illustration solves a problem photographs cannot
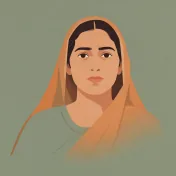
When the subject is sensitive, an illustration lets you show a situation without exposing a person. A drawn figure is understood as a type rather than an individual, so nobody is identified, nobody consented under pressure, and nobody’s face is attached to a topic for the rest of their life.
It also allows deliberate omission. A drawing can leave out the clutter that a photograph must include, which is the same act as cropping but visible and honest: nobody thinks a drawing was the whole room.
Diagrams lie by boundary
The limitation of diagrams is specific and worth knowing: a box-and-arrow drawing asserts that the world has boxes and arrows in it.
Draw a system as five boxes and you have claimed there are five distinct components with clean interfaces. Very often the real thing is a continuum, or the boxes overlap, or one of them is actually three things that nobody has separated. The diagram is now clearer than the truth, and the reader will remember the boxes.
This is not an argument against diagrams: a simplification you can name is worth more than a fog. It is an argument for saying what you simplified. One line under the drawing does it: “simplified; stages 3 and 4 overlap in practice.”
The free path is complete
- Inkscape: vector drawing, illustrations, cutaways, print-ready SVG and PDF.
- Krita: painting and raster illustration, good with a tablet or a mouse.
- diagrams.net and Excalidraw: box-and-arrow diagrams in a browser, including on a phone.
- Mermaid: diagrams written as text, which version-control well and regenerate when the content changes.
- GIMP or Photopea: raster editing and photo preparation; Photopea runs in a browser and opens PSD files.
- Graphviz: for a diagram whose layout should be computed rather than arranged by hand.
None of this needs a subscription and most of it runs on a low-end laptop.
Consistency matters more than quality
The practical failure in most small projects is not that the illustrations are poor. It is that there are three styles in one document: a photograph, a clip-art icon and a hand-drawn diagram, each from a different source.
A reader reads that as three separate voices and downgrades the whole piece. Pick one drawing style (same line weight, same palette from your role-based colours, same level of detail) and apply it to everything you draw. A consistently mediocre set of diagrams looks considered. An inconsistent set of good ones looks assembled.
Every lesson here is open. Your progress is recorded once you pass the Making Things with AI exam.
Check your understanding
An article explains how a sewing machine forms a lock stitch. Why will a high-quality photograph of the machine fail where a diagram succeeds?
Pick the one you would defend. Your answer stays private.
 Stuck on something?Ask Meher, your AI tutor